Exploratory analysis of a ride-sharing database using SQL and Python to investigate demand patterns, revenue performance, customer behavior, and operational efficiency.
import sqlite3import pandas as pdimport matplotlib.pyplot as pltimport matplotlib.cm as cmDB_PATH ="data/rideshare.db"# update path if neededconn = sqlite3.connect(DB_PATH)def q(sql):return pd.read_sql(sql, conn)
Database overview
tables = q("SELECT name FROM sqlite_master WHERE type='table' ORDER BY name")['name'].tolist()row_counts = []for table in tables: row_counts.append({"table": table,"rows": q(f"SELECT COUNT(*) AS n FROM {table}")["n"][0] })pd.DataFrame(row_counts)
table
rows
0
cancellations
2966
1
drivers
400
2
locations
40
3
payments
16827
4
reviews
15136
5
riders
1600
6
trips
20000
7
users
2000
This database contains operational data from a ride-sharing platform, including information about trips, riders, drivers, payments, reviews, and locations.
The dataset consists of approximately 20,000 trips, of which 2,966 were cancelled. It includes 400 drivers serving 1,600 riders across 40 locations. In addition, the database contains 16,827 payment records and 15,136 customer reviews, providing a comprehensive view of both operational performance and customer experience.
Tables Overview
Cancellations
q("""SELECT *FROM cancellationsLIMIT 3;""")
cancel_id
trip_id
cancelled_by
reason
cancelled_at
0
1
2
driver
personal emergency
2024-01-25 20:55:28
1
2
7
driver
wrong pickup
2023-06-02 19:32:48
2
3
16
driver
rider rating too low
2022-05-13 15:56:17
Drivers
q("""SELECT *FROM driversLIMIT 3;""")
driver_id
user_id
vehicle_make
vehicle_model
vehicle_year
license_plate
rating
join_date
is_active
0
1
1781
Kia
Soul
2015
ZVJ-2140
4.10
2019-12-22
1
1
2
408
Hyundai
Tucson
2016
WLW-3906
4.21
2020-12-14
1
2
3
693
Hyundai
Sonata
2014
WEA-5140
3.81
2023-07-25
1
Locations
q("""SELECT *FROM locationsLIMIT 3;""")
location_id
zone_name
city
latitude
longitude
zone_type
0
1
Times Square
New York
40.7580
-73.9855
commercial
1
2
JFK Airport
New York
40.6413
-73.7781
airport
2
3
LaGuardia Airport
New York
40.7769
-73.8740
airport
q("""SELECT DISTINCT cityFROM locations;""")
city
0
New York
1
Chicago
2
Los Angeles
3
Houston
Payments
q("""SELECT *FROM paymentsLIMIT 3;""")
payment_id
trip_id
amount
method
status
paid_at
0
1
1
68.55
wallet
success
2024-06-24 14:24:15
1
2
3
6.36
wallet
success
2023-08-17 09:36:16
2
3
4
21.98
cash
success
2022-11-21 10:17:36
Reviews
q("""SELECT *FROM reviewsLIMIT 3;""")
review_id
trip_id
reviewer_id
reviewee_id
rating
comment
reviewed_at
0
1
1
1958
1001
4
Very comfortable ride.
2024-06-24 14:52:11
1
2
1
1001
1958
4
Super friendly and helpful.
2024-06-24 16:09:11
2
3
3
324
373
4
Very clean car.
2023-08-17 11:08:06
Riders
q("""SELECT *FROM ridersLIMIT 3;""")
rider_id
user_id
rating
total_trips
created_at
0
1
1958
4.66
1
2020-09-13 01:52:12
1
2
373
3.76
2
2019-11-03 13:23:24
2
3
680
3.03
8
2020-01-23 08:54:39
Trips
q("""SELECT *FROM tripsLIMIT 3;""")
trip_id
rider_id
driver_id
pickup_location_id
dropoff_location_id
requested_at
started_at
completed_at
status
distance_km
duration_mins
base_fare
surge_multiplier
total_fare
payment_method
0
1
1
34
26
29
2024-06-24 12:20:11
2024-06-24 12:29:11
2024-06-24 14:24:11
completed
39.14
115
68.55
1.0
68.55
wallet
1
2
2
185
18
12
2024-01-25 20:52:28
2024-01-25 20:54:28
None
cancelled
9.53
22
17.38
1.0
17.38
wallet
2
3
2
126
13
15
2023-08-17 09:30:06
2023-08-17 09:32:06
2023-08-17 09:36:06
completed
2.78
4
6.36
1.0
6.36
wallet
Users
q("""SELECT *FROM usersLIMIT 3;""")
user_id
name
email
phone
city
date_joined
is_driver
0
1
David White
david.white@gmail.com
+1-809-169-4853
Houston
2019-09-03
0
1
2
Justin Young
justin.young@icloud.com
+1-808-140-2343
Houston
2022-09-08
1
2
3
Scott Kelly
scott.kelly@icloud.com
+1-523-367-4346
Los Angeles
2020-05-03
0
Time Range
q("""SELECT MIN(requested_at) AS earliest_request FROM trips;""")
earliest_request
0
2022-01-01 00:32:27
q(""" SELECT MAX(requested_at) AS latest_request FROM trips;""")
latest_request
0
2024-06-29 23:38:24
Duplicity check
Prior to calculating KPIs and exploring business metrics, it is important to verify the integrity of the dataset. Duplicate records can distort results and lead to misleading conclusions, so the first step is to identify and investigate any potential duplicates.
No duplicate records were identified in any of the analyzed tables.
KPI Trips
q("""SELECT SUM(CASE WHEN status != 'in_progress' THEN 1 ELSE 0 END) AS finished_trips, SUM(CASE WHEN status='completed' THEN 1 ELSE 0 END) AS completed_trips, SUM(CASE WHEN status='cancelled' THEN 1 ELSE 0 END) AS cancelled_trips, sum(CASE WHEN status='in_progress' THEN 1 ELSE 0 END) AS in_progress_trips, ROUND(100.0 * SUM(CASE WHEN status='cancelled' THEN 1 ELSE 0 END) / SUM(CASE WHEN status != 'in_progress' THEN 1 ELSE 0 END), 2) AS cancellation_rate_pct, ROUND(SUM(CASE WHEN status='completed' THEN total_fare ELSE 0 END), 2) AS revenue, ROUND(AVG(CASE WHEN status='completed' THEN total_fare END), 2) AS avg__fareFROM trips;""")
finished_trips
completed_trips
cancelled_trips
in_progress_trips
cancellation_rate_pct
revenue
avg__fare
0
19793
16827
2966
207
14.99
604589.92
35.93
Trip KPIs provide a high-level overview of the platform’s operational performance. The dataset contains 20,000 trip requests, demonstrating substantial platform activity across the analyzed locations.
Of all recorded trips, 16,827 were successfully completed, while 2,966 were cancelled, resulting in a cancellation rate of 14.99%. This means that approximately one out of every seven trip requests did not result in a completed ride. Although the majority of trips were fulfilled successfully, the cancellation rate suggests an opportunity to investigate the underlying causes and identify potential improvements in service reliability.
At the time of data collection, 207 trips were still in progress, representing a small portion of total activity.
Completed trips generated total revenue of $604,589.92, with an average fare of $35.93 per ride.
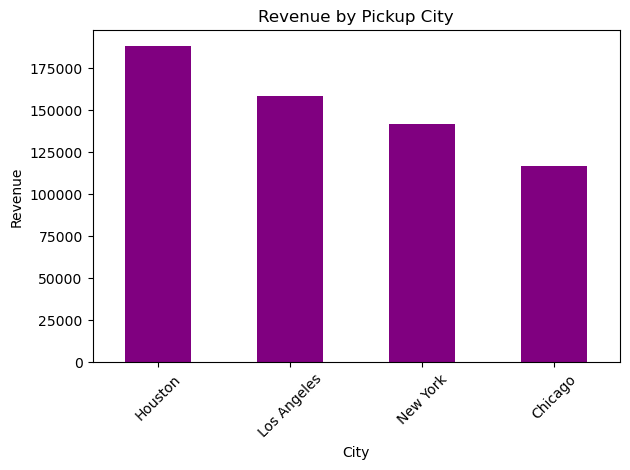
Revenue by city
revenue_by_city = q("""SELECT l.city, COUNT(*) AS trips, ROUND(SUM(CASE WHEN t.status='completed' THEN t.total_fare ELSE 0 END), 2) AS revenue, ROUND(AVG(CASE WHEN t.status='completed' THEN t.total_fare END), 2) AS avg_fareFROM trips tJOIN locations l ON t.pickup_location_id = l.location_idGROUP BY l.cityORDER BY revenue DESC;""")revenue_by_city
city
trips
revenue
avg_fare
0
Houston
5329
188019.38
42.42
1
Los Angeles
4284
158414.18
44.25
2
New York
5694
141638.34
29.29
3
Chicago
4693
116518.02
29.28
ax = revenue_by_city.plot(kind="bar", x="city", y="revenue", legend=False, color="Purple")ax.set_title("Revenue by Pickup City")ax.set_xlabel("City")ax.set_ylabel("Revenue")plt.xticks(rotation=45)plt.tight_layout()plt.show()
New York leads in demand, but Houston leads in revenue. This suggests that ride pricing and trip characteristics have a greater impact on revenue generation than trip volume alone.
Top pickup zones
q("""SELECT l.city, l.zone_name, COUNT(*) AS pickup_count, ROUND(SUM(CASE WHEN t.status='completed' THEN t.total_fare ELSE 0 END), 2) AS revenueFROM trips tJOIN locations l ON t.pickup_location_id = l.location_idGROUP BY l.city, l.zone_nameORDER BY pickup_count DESCLIMIT 10;""")
city
zone_name
pickup_count
revenue
0
New York
Flushing
607
17434.69
1
New York
Greenwich Village
593
12054.88
2
New York
Upper West Side
593
11927.03
3
New York
Times Square
582
10658.90
4
New York
JFK Airport
578
24373.69
5
Houston
Downtown Houston
568
16397.69
6
New York
LaGuardia Airport
566
21147.75
7
New York
Grand Central
563
9526.56
8
New York
Harlem
563
13431.68
9
Houston
Medical Center
556
13936.07
Pickup locations are key indicators of rider demand. By identifying the most frequently used pickup zones and the revenue they generate, we can determine which areas contribute most to the platform’s activity and financial performance. LaGuardia Airport ranks among the top pickup zones in both trip volume and revenue generation.
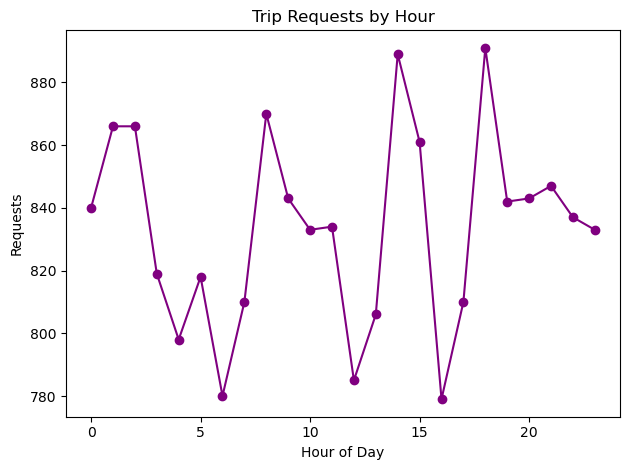
Peak demand hours
peak_hours = q("""SELECT CAST(strftime('%H', requested_at) AS INTEGER) AS hour, COUNT(*) AS requests, ROUND(AVG(surge_multiplier), 2) AS avg_surge, ROUND(100.0 * SUM(CASE WHEN status='cancelled' THEN 1 ELSE 0 END) / COUNT(*), 2) AS cancellation_rate_pctFROM tripsGROUP BY hourORDER BY hour;""")peak_hours
hour
requests
avg_surge
cancellation_rate_pct
0
0
840
1.38
15.12
1
1
866
1.36
16.40
2
2
866
1.02
14.78
3
3
819
1.02
14.77
4
4
798
1.02
15.16
5
5
818
1.02
13.94
6
6
780
1.01
12.56
7
7
810
1.89
13.58
8
8
870
1.92
15.29
9
9
843
1.02
12.22
10
10
833
1.02
13.09
11
11
834
1.02
16.31
12
12
785
1.02
14.01
13
13
806
1.01
12.53
14
14
889
1.01
14.40
15
15
861
1.02
16.14
16
16
779
1.01
15.53
17
17
810
1.87
16.79
18
18
891
1.90
14.37
19
19
842
1.92
18.29
20
20
843
1.02
13.52
21
21
847
1.02
15.23
22
22
837
1.35
15.65
23
23
833
1.38
15.97
ax = peak_hours.plot(kind="line", x="hour", y="requests", marker="o", legend=False, color="Purple")ax.set_title("Trip Requests by Hour")ax.set_xlabel("Hour of Day")ax.set_ylabel("Requests")plt.tight_layout()plt.show()
While this analysis provides a high-level overview of hourly demand patterns, a more detailed breakdown of trip activity can be explored in the accompanying Power BI dashboard, which allows users to interactively investigate trends across cities, pickup zones, and operational metrics.
Cancellation reasons
q("""SELECT cancelled_by, reason, COUNT(*) AS cancellationsFROM cancellationsGROUP BY cancelled_by, reasonORDER BY cancellations DESC;""")
cancelled_by
reason
cancellations
0
rider
too long wait
284
1
rider
changed my mind
283
2
rider
personal emergency
262
3
rider
waited too long
262
4
rider
price too high
250
5
rider
duplicate booking
249
6
rider
found another ride
248
7
rider
driver too far
231
8
driver
wrong pickup
137
9
driver
personal emergency
134
10
driver
area not safe
133
11
driver
system error
133
12
driver
vehicle issue
128
13
driver
rider rating too low
124
14
driver
rider unresponsive
108
Trip cancellations can have a significant impact on both customer satisfaction and revenue generation. Understanding why rides are cancelled helps identify operational challenges and opportunities for service improvement. The analysis shows that rider-initiated cancellations account for the majority of cancelled trips. The most common reasons include long waiting times, changes in travel plans, personal emergencies, and concerns about ride pricing. In particular, “too long wait” and “waited too long” appear among the leading cancellation reasons, suggesting that driver availability and pickup times may influence rider retention and trip completion rates. Price sensitivity also plays a role, with “price too high” ranking among the most frequent rider cancellation reasons. This may indicate that some customers are unwilling to accept higher fares during periods of increased demand. Driver-initiated cancellations occur less frequently but reveal different operational challenges. Common reasons include incorrect pickup locations, vehicle issues, safety concerns, and unresponsive riders. These findings suggest that both technical and logistical factors contribute to service disruptions. Overall, the results indicate that reducing passenger wait times and improving the pickup process could help decrease cancellation rates and improve the overall customer experience.
Driver leaderboard
q("""SELECT d.driver_id, u.name, u.city, d.vehicle_make, d.vehicle_model, COUNT(t.trip_id) AS completed_trips, ROUND(SUM(t.total_fare), 2) AS revenue, ROUND(AVG(t.total_fare), 2) AS avg_fare, d.ratingFROM trips tJOIN drivers d ON t.driver_id = d.driver_idJOIN users u ON d.user_id = u.user_idWHERE t.status = 'completed'GROUP BY d.driver_id, u.name, u.city, d.vehicle_make, d.vehicle_model, d.ratingORDER BY revenue DESCLIMIT 10;""")
driver_id
name
city
vehicle_make
vehicle_model
completed_trips
revenue
avg_fare
rating
0
10
Andrew Morales
Houston
Ford
Escape
76
3679.84
48.42
4.97
1
234
George Gray
Los Angeles
Toyota
Highlander
74
3484.90
47.09
4.71
2
57
Christopher Watson
Houston
Ford
F-150
73
3299.26
45.20
4.82
3
98
Jeffrey Ramirez
Los Angeles
Subaru
Outback
74
3279.39
44.32
4.96
4
303
Raymond Moore
Los Angeles
Tesla
Model X
64
3269.23
51.08
4.68
5
337
Justin Young
Houston
Tesla
Cybertruck
77
3111.72
40.41
4.87
6
34
Charles Cook
Los Angeles
Tesla
Model 3
62
3072.33
49.55
4.97
7
396
Jennifer Johnson
Los Angeles
Tesla
Cybertruck
69
3047.77
44.17
4.94
8
100
Debra Adams
Los Angeles
Chevrolet
Silverado
68
3041.11
44.72
4.40
9
63
Nancy Price
Los Angeles
Ford
Escape
60
3010.65
50.18
4.49
The top-performing drivers generated between $3,000 and $3,700 in revenue while maintaining high customer ratings, most of which exceed 4.7 out of 5. This suggests that strong financial performance is often accompanied by positive rider experiences.
Rider value
q("""SELECT r.rider_id, u.name, u.city, COUNT(t.trip_id) AS completed_trips, ROUND(SUM(t.total_fare), 2) AS rider_value, ROUND(AVG(t.total_fare), 2) AS avg_trip_value, r.ratingFROM trips tJOIN riders r ON t.rider_id = r.rider_idJOIN users u ON r.user_id = u.user_idWHERE t.status = 'completed'GROUP BY r.rider_id, u.name, u.city, r.ratingORDER BY rider_value DESCLIMIT 10;""")
rider_id
name
city
completed_trips
rider_value
avg_trip_value
rating
0
739
Linda Gonzalez
New York
88
3485.26
39.61
3.42
1
689
Brian Collins
Chicago
87
3361.59
38.64
4.08
2
646
Emma Cooper
Houston
87
3288.69
37.80
3.44
3
1442
Elizabeth Walker
Los Angeles
87
3271.96
37.61
3.52
4
1288
Janet Hill
Los Angeles
94
3243.69
34.51
3.09
5
1559
Debra Howard
Houston
82
3196.50
38.98
3.81
6
1228
Edward Baker
Houston
75
3170.95
42.28
3.43
7
595
Alexander Davis
Houston
84
3158.86
37.61
3.52
8
833
Brian Green
Chicago
88
3156.54
35.87
4.97
9
301
Brenda Lee
Houston
78
3124.92
40.06
4.06
Customer Value (CV) measures the total revenue generated by a rider throughout their relationship with the platform. Identifying high-value customers helps businesses understand which users contribute most to revenue and highlights the importance of customer retention. The top riders in the dataset generated between $3,100 and $3,500 revenue, completing between 75 and 94 trips each during the analyzed period. This demonstrates that consistent platform usage can create substantial long-term value for the business.
Conclusion
The analysis revealed that platform performance is influenced by a combination of trip demand, fare values, customer retention, and operational efficiency. Understanding these factors can help ride-sharing companies improve service quality, reduce cancellations, and maximize revenue.
 Houston, USA - Erik Mclean, pexels.com